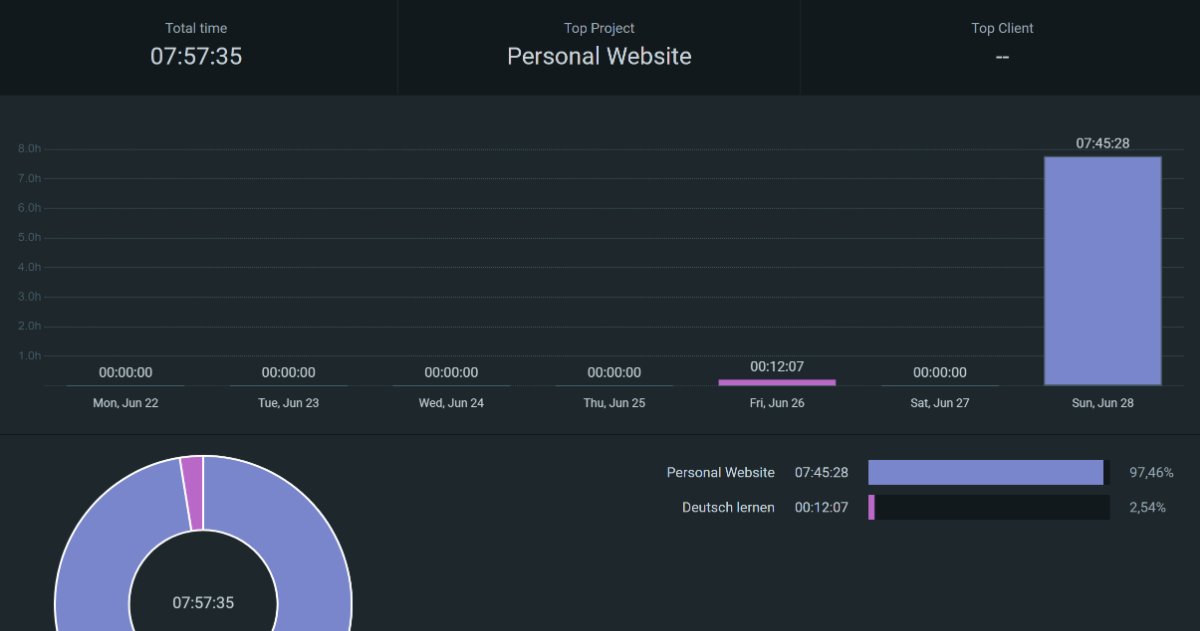
Hello everyone. It’s time for my weekly report. Last week, I was actively improving my personal website, and this week I decided to conduct a load test on it. Here’s the backstory: I often marvel at cloud service prices 🌧️💸 and find myself mentally asking: why do we have to pay so much for hosting a tiny site that could fit on an ARM computer the size of a matchbox? So, on Sunday, I decided to check whether my ARM computer is actually capable of anything or if it’s just self-deception.
Orange Pi Web Server Load Test 🍊📊
I ran the following test:
-
Scenario: A user visits my blog in their
browser and reads every post one by one.
- There are 61 posts in total, with several images in each.
- Cache disabled.
- Initial load: Everything is loaded at once: HTML, CSS, JavaScript, and icons.
-
Subsequent load: The text of each blog and
its corresponding images are loaded.
- This reflects reality because an SPA (Single Page Application) won’t reload CSS and JS when moving between posts.
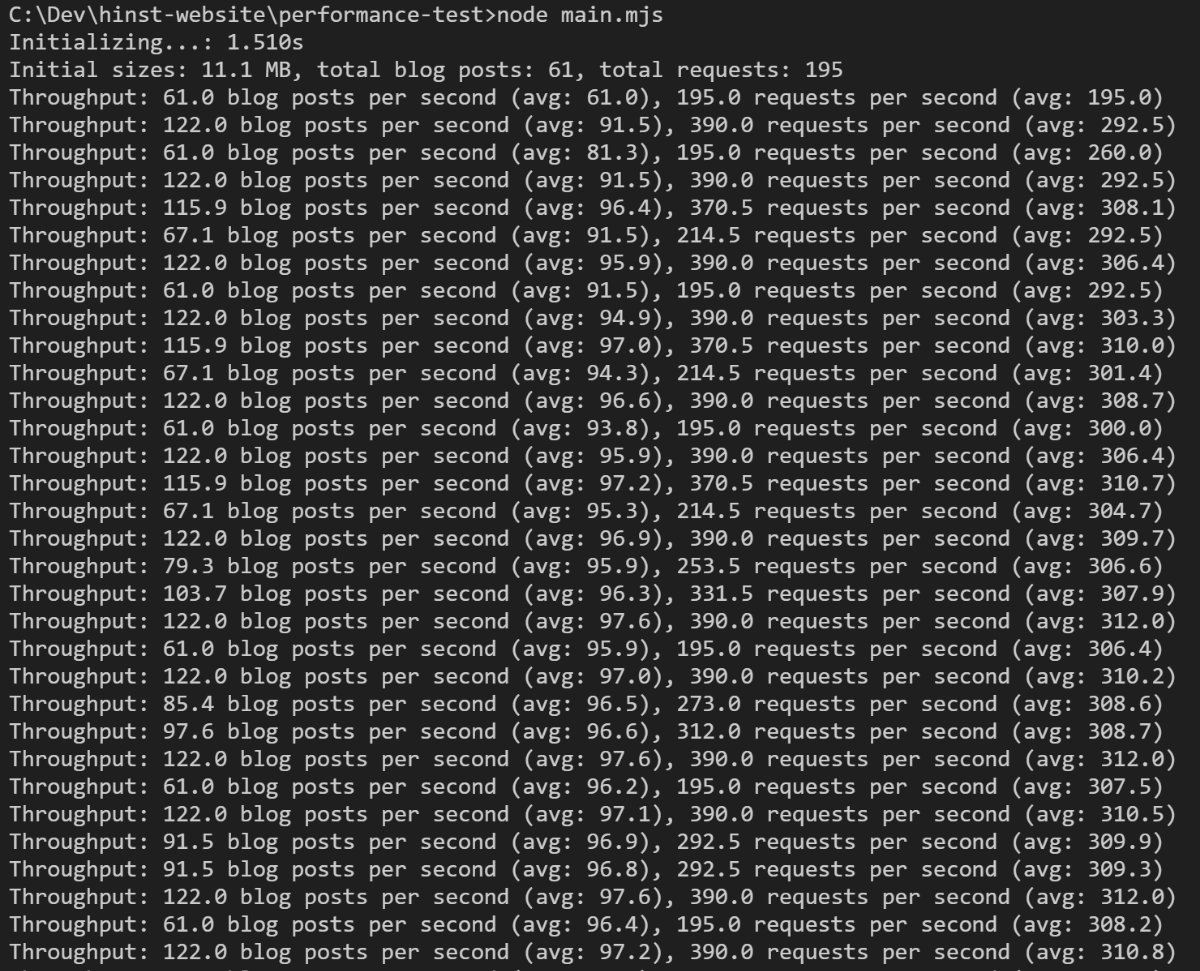
The results were as follows:
-
Blogs: 97 views per second
- Requests: 310 HTTP requests per second
-
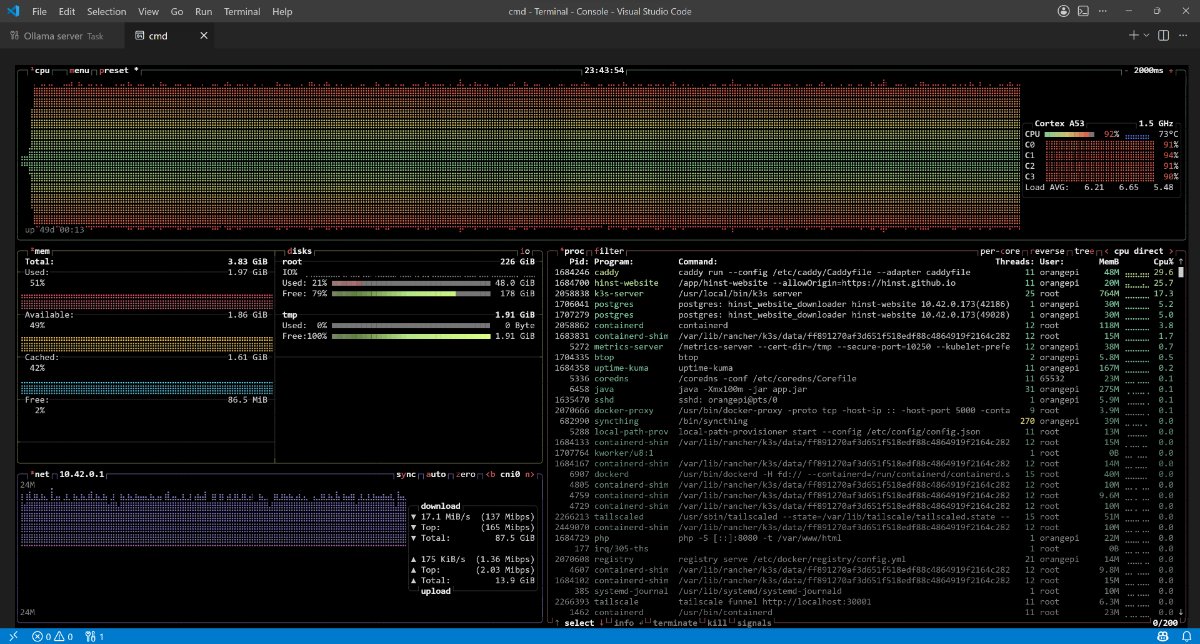
Orange Pi Load:
-
CPU: 90%
- Caddy: 30% (web proxy server)
- hinst-website: 30% (my program written in Go)
- PostgreSQL: 10% (database)
- Other: 20% (system processes and Kubernetes)
- Memory: 50% (out of 4 GB)
- Temperature: 75 degrees Celsius
-
CPU: 90%
Conclusions:
-
The site can handle approximately 90 users
who are simultaneously clicking on posts every second.
- The load depends on user behavior; they might be resting and not clicking anything, or they might get intense and click even more frequently.
-
Caddy compression settings partially affect performance.
- If we increase the compression level from fastest to default, we get only 290 requests per second instead of 310.
That was the test. If I make any significant updates to my personal website, I can repeat the load test and compare the results before and after.